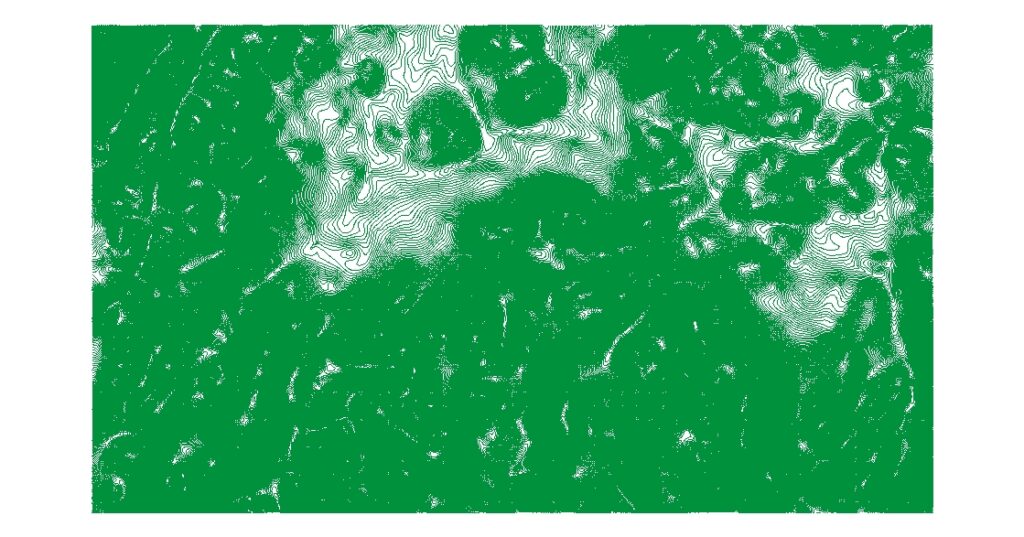
A 1 metre contour interval means that the contour lines on a topographic map represent a change in elevation of 1 metre between each adjacent contour line. In other words, each contour line on the map is separated by 1 metre in elevation from the next adjacent contour line. A 1 metre contour interval is considered a relatively high-resolution map, as it provides a detailed representation of the topography of an area.
The advantage of using a 1 metre contour interval is that it allows for more accurate measurements of the elevation and slope of the land. This can be important for engineering and construction projects, as well as for natural resource management and environmental planning.
However, producing maps with a 1 metre contour interval can be time-consuming and expensive, as it requires high-quality surveying data and advanced mapping technology. In addition, the high level of detail in a 1 metre contour map may not always be necessary for certain applications, such as recreational hiking or general land-use planning.
Overall, a 1 metre contour interval is a valuable tool for providing a highly detailed representation of the topography of an area, but its use depends on the specific needs and applications of the user.
Location: Essel Mining and Industries Limited, Deojhar, Odisha.
Long: 85°14’15.73”E
Latt: 21°53’33.68”N
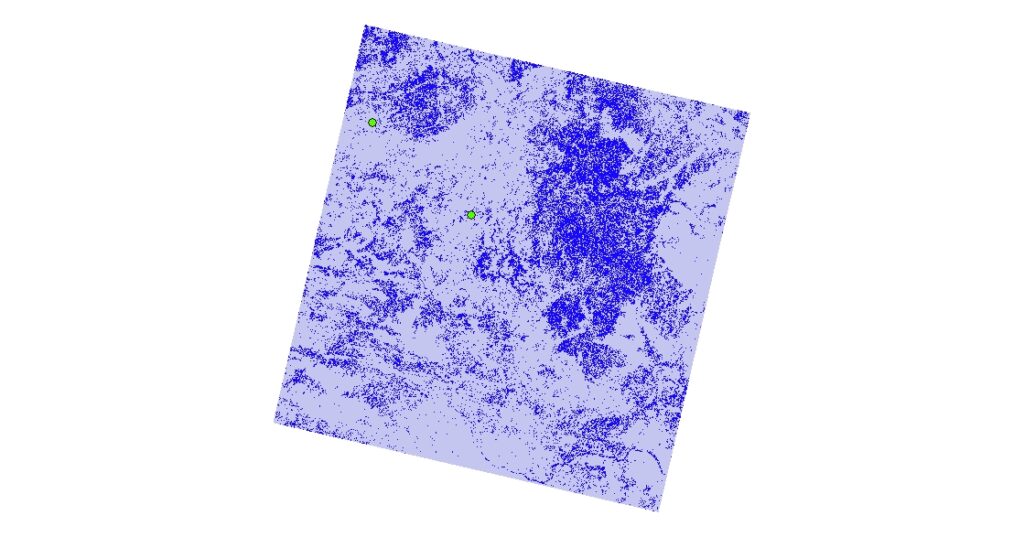
Iron ore concentration show in Violet colour in Deojhar Odisha.
Using Iron Ore Indexing using red and blue bands. Creating digital elevation model and extracting out the contours of 1 metre interval for calculating surface volume which gives the output in cubic metres.
After Analysis:
Area size: 210 sq km
Total Concentration (surface volume) : 1.929356 cubic meters (approx)
Reference plane above contour line i.e 595 metre.
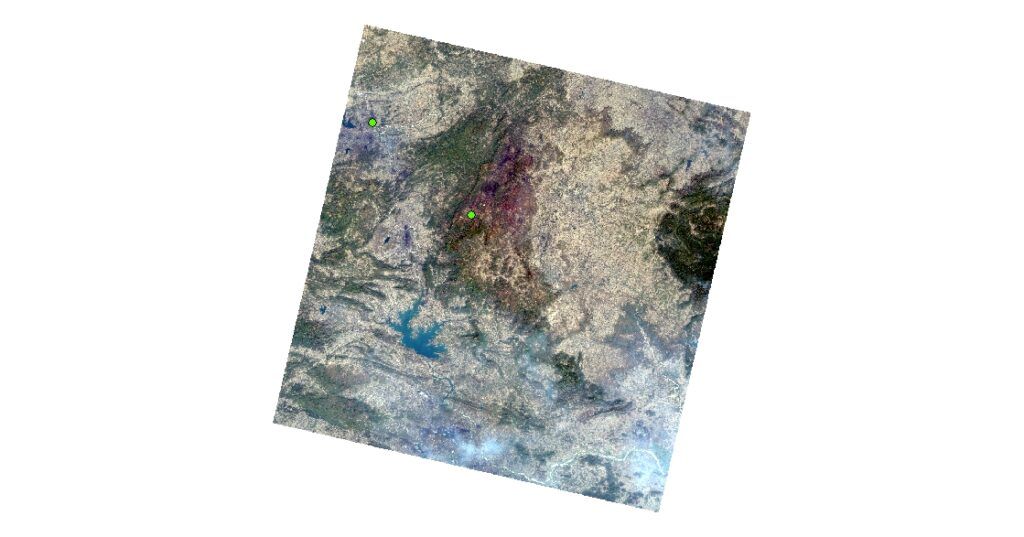
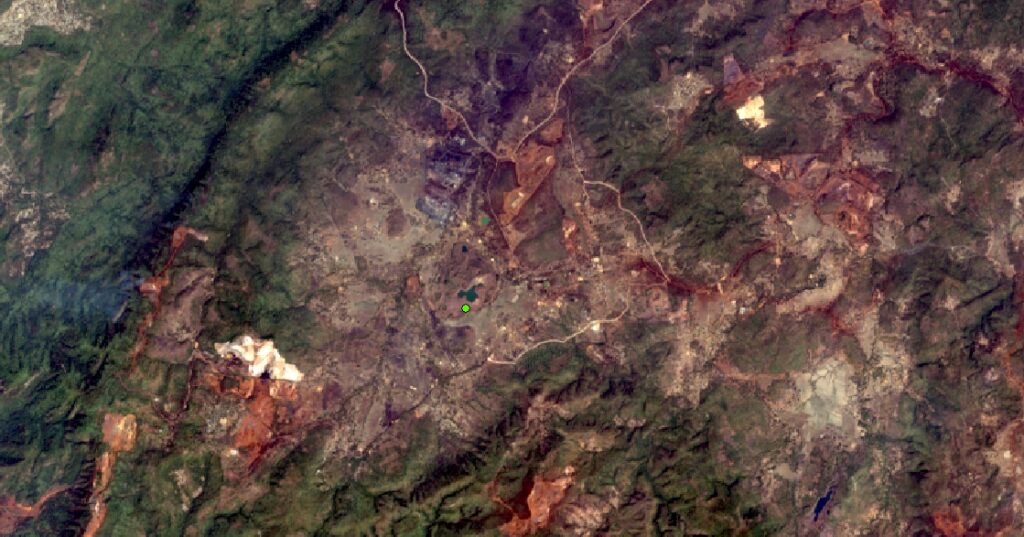
Green dot identifies location of Iron Ore Mines.
RGB Composite.
Landsat VIII showing True colour Composite.
Geospatial analysis using image indexing can be a useful tool for identifying iron ore concentration. Here are some steps that can be followed:
Acquire satellite imagery: Obtain high-resolution satellite imagery of the Odisha region. Several sources provide such imagery, including ISRO Bhuvan, NASA Earth Observatory and commercial providers like DigitalGlobe and Planet Labs, USGS.
Preprocessing: Preprocessing involves removing noise, distortion, and irrelevant data from the images. The preprocessing steps may include atmospheric correction, geometric correction, and radiometric calibration to enhance the quality of the image.
Image indexing: Image indexing is the process of assigning a unique identifier to each image. This helps in organizing the data and retrieving specific images quickly. Image indexing can be done using various techniques such as color histogram, edge detection, and texture analysis.
Feature extraction: Feature extraction is the process of identifying significant features in the image that represent the presence of iron ore. This can be done using machine learning algorithms such as Random Forest or Support Vector Machine (SVM) or deep learning techniques such as Convolutional Neural Networks (CNNs).
Classification: Once the features have been extracted, the next step is to classify the image into different classes. In this case, we are interested in identifying areas that have a high concentration of iron ore. This can be achieved using supervised or unsupervised classification techniques. One common technique is Maximum Likelihood Classification.
Validation: Finally, the accuracy of the classification needs to be validated using ground truth data. Ground truth data can be obtained by field surveys or by comparing the classified image with existing maps.
DEM stands for Digital Elevation Model. It is a digital representation of the elevation or height of a landscape. DEMs are typically created using data obtained from satellite or aerial remote sensing systems, or by surveying the terrain on the ground.
DEM data is stored as a grid or raster, where each pixel in the grid represents a specific elevation. The resolution of the DEM, or the size of the pixel, depends on the quality and availability of the source data. High-resolution DEMs are typically used for detailed analysis and modeling, while lower-resolution DEMs are used for broader-scale applications.
DEM data is used for a variety of purposes, including:
Topographic analysis: DEMs are used to analyze the topography of a landscape, including slope, aspect, and curvature.
Floodplain mapping: DEMs are used to create floodplain maps that help to identify areas that are prone to flooding.
Environmental modeling: DEMs are used in environmental modeling to simulate water flow, erosion, and sediment transport.
Infrastructure planning: DEMs are used to plan and design infrastructure projects such as roads, bridges, and pipelines.
Natural resource management: DEMs are used to manage natural resources such as forests, watersheds, and wildlife habitats.
Contour lines are lines that connect points of equal elevation on a topographic map. These lines are used to represent the shape and relief of the land, and provide valuable information about the topography of an area.
Contour lines are typically drawn at fixed intervals of elevation, called the contour interval. For example, a contour interval of 10 meters means that each contour line represents a change in elevation of 10 meters.
On a topographic map, contour lines are drawn as smooth, continuous lines that never cross or intersect. The contour lines form a pattern that reflects the shape of the land, with concentric lines indicating hills, ridges, and peaks, and closely spaced lines indicating steep slopes.
Contour lines are used in a variety of applications, including:
Navigation: Contour lines are used by hikers, mountaineers, and other outdoor enthusiasts to navigate in the mountains and other rugged terrain.
Surveying: Contour lines are used by surveyors to create topographic maps that are used for engineering and construction projects.
Environmental planning: Contour lines are used in environmental planning to identify areas that are vulnerable to erosion, landslides, and flooding.
Resource management: Contour lines are used in natural resource management to identify areas of high biodiversity, to plan trails and other recreational activities, and to manage forest resources.
Overall, geospatial analysis using image indexing can be a powerful tool for identifying iron ore concentration in Odisha. However, the accuracy of the results depends on the quality of the data, preprocessing, and classification techniques used.